Easy CloudWatch Dashboards with the CDK

If you have ever worked in an enterprise you know that one thing tech managers love is dashboards. I don’t blame them, they are great way to provide a good look into how a service or platform is performing. Unfortunately, CloudWatch Dashboards kinda suck to automate with CloudFormation.

The AWS::CloudWatch::Dashboard just has a property of DashboardBody. It takes a JSON formatted string and any resources in there have to be subbed/joined in. It isn’t pretty. For an example take a look at the aws-efs-tutorial sample here.

1
2
3
4
5
6
7
8
9
EfsDashboardRetain:
Type: AWS::CloudWatch::Dashboard
Condition: RetainDashboard
DeletionPolicy: Retain
DependsOn: [ BurstCreditBalanceIncreaseAlarmRetain, BurstCreditBalanceDecreaseAlarmRetain, CriticalAlarmRetain, WarningAlarmRetain ]
Properties:
DashboardName: !Ref ElasticFileSystem
DashboardBody:
{"Fn::Join":["",['{"widgets":[{"type":"metric","x":0,"y":0,"width":6,"height":6,"properties":{"view":"timeSeries","stacked":false,"metrics":[["AWS/EFS","TotalIOBytes","FileSystemId","',!Ref 'ElasticFileSystem','",{"stat":"Sum","period":60}]],"region":"',!Ref 'AWS::Region','","title":"Throughput"}},{"type":"metric","x":18,"y":0,"width":6,"height":3,"properties":{"view":"singleValue","stacked":false,"metrics":[["AWS/EFS","PermittedThroughput","FileSystemId","',!Ref 'ElasticFileSystem','",{"stat":"Maximum"}]],"region":"',!Ref 'AWS::Region','","period": 60}},{"type":"metric","x":6,"y":0,"width":6,"height":6,"properties":{"view":"timeSeries","stacked":false,"metrics":[["AWS/EFS","TotalIOBytes","FileSystemId","',!Ref 'ElasticFileSystem','",{"stat":"SampleCount","period":60}]],"region":"',!Ref 'AWS::Region','","title":"IOPS"}},{"type":"metric","x":12,"y":0,"width":6,"height":6,"properties":{"view":"timeSeries","stacked":false,"metrics":[["AWS/EFS","BurstCreditBalance","FileSystemId","',!Ref 'ElasticFileSystem','",{"stat":"Maximum","period":60}]],"region":"',!Ref 'AWS::Region','"}},{"type":"metric","x":18,"y":3,"width":6,"height":3,"properties":{"view":"singleValue","metrics":[[ "Custom/EFS", "SizeInBytes", "FileSystemId","',!Ref 'ElasticFileSystem','"]],"region":"',!Ref 'AWS::Region','"}},{"type":"metric","x":0,"y":6,"width":6,"height":6,"properties":{"title":"Burst credit balance increase threshold","annotations":{"alarms":["',!GetAtt BurstCreditBalanceIncreaseAlarmRetain.Arn,'"]},"view":"timeSeries","stacked":false}},{"type":"metric","x":6,"y":6,"width":6,"height":6,"properties":{"title":"Burst credit balance decrease threshold","annotations":{"alarms":["',!GetAtt BurstCreditBalanceDecreaseAlarmRetain.Arn,'"]},"view":"timeSeries","stacked":false}},{"type":"metric","x":12,"y":6,"width":6,"height":6,"properties":{"title":"Burst credit balance - Critical","annotations":{"alarms":["',!GetAtt CriticalAlarmRetain.Arn,'"]},"view":"timeSeries","stacked":false}},{"type":"metric","x":18,"y":6,"width":6,"height":6,"properties":{"title":"Burst credit balance - Warning","annotations":{"alarms":["',!GetAtt WarningAlarmRetain.Arn,'"]},"view":"timeSeries","stacked":false}}]}']]}

Is unreadable, difficult to create and will result in a lot of trial and error to get right. Good thing there is a new and better way to do this via the CDK.

Using the CDK resource aws-cloudwatch it is very easy to create new dashboard, graphs and widgets.

Example:

1
2
3
4
5
6
7
8
9
10
11
12
13
14
15
16
17
18
19
20
21
22
23
24
25
26
27
28
29
30
31
32
33
34
35
36
# This assumes an existing self.service.load_balancer ALB resource
# ...
http_5xx_metric = self.service.load_balancer.metric_http_code_elb(
code=aws_elasticloadbalancingv2.HttpCodeElb.ELB_5XX_COUNT
)

http_requests_metric = self.service.load_balancer.metric_request_count(
statistic="SUM"
)

http_response_times = self.service.load_balancer.metric_target_response_time()

load_balancer_widget = cw.GraphWidget(
title="Load Balancer Metrics",
height=8,
width=12,
left=[http_5xx_metric],
right=[http_requests_metric]
)

http_response_widget = cw.GraphWidget(
title="Response Times",
height=8,
width=12,
left=[http_response_times]
)

cw.Dashboard(
self,
"Dashboard",
dashboard_name="Service-Status",
widgets=[
[service_cpu_widget, service_health_widget],
[load_balancer_widget, http_response_widget]
]
)

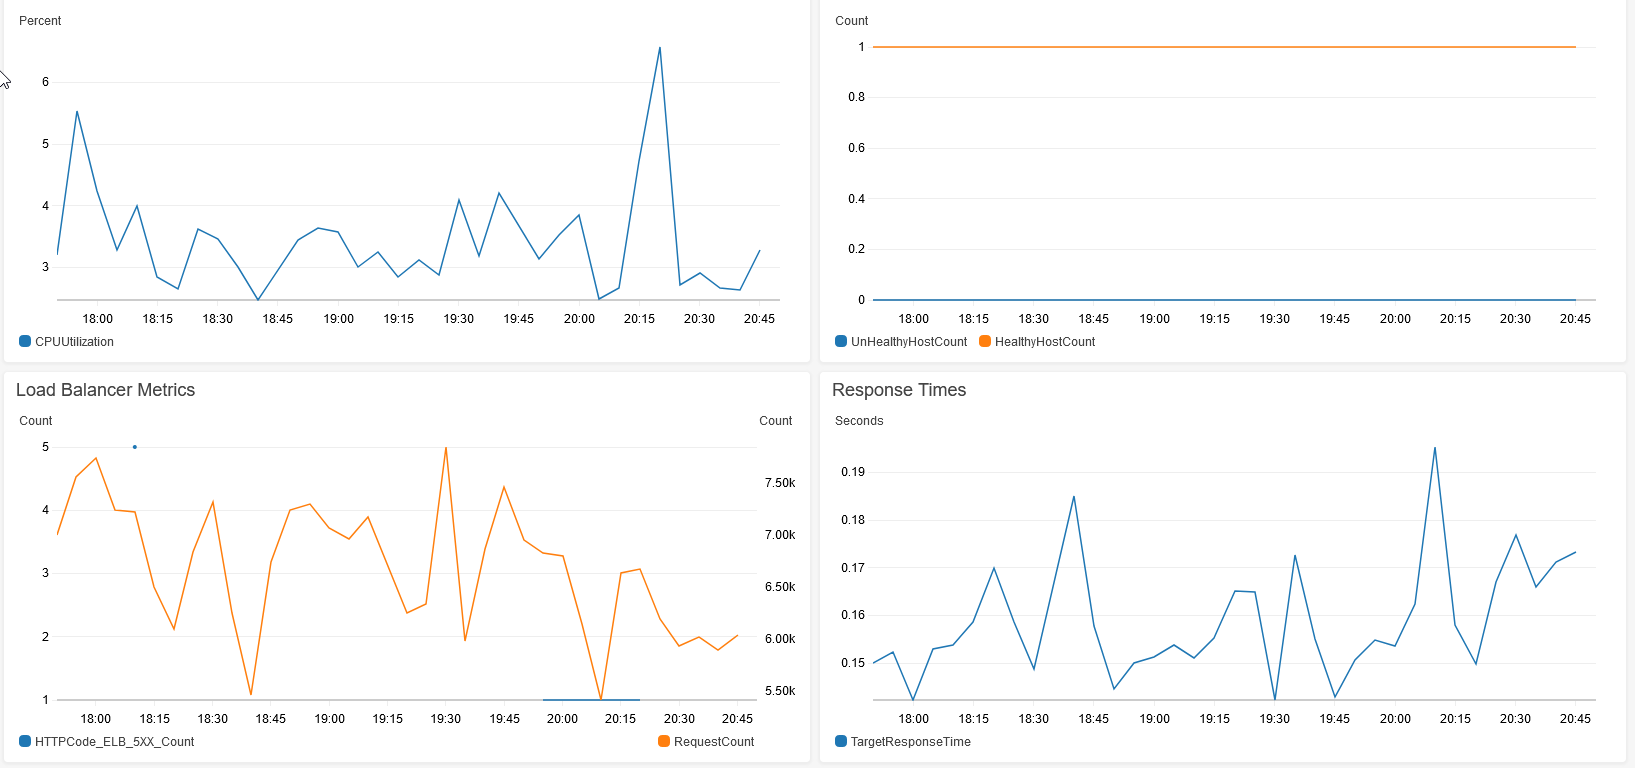
As you can see here, most L2 resources expose a .metric_*() that can be used for creating the widgets, then those widgets can be added to dashboards in a defined 3 dimensional array. This will create a dashboard showing load balancer and ECS metrics over time and is much easier to manage.
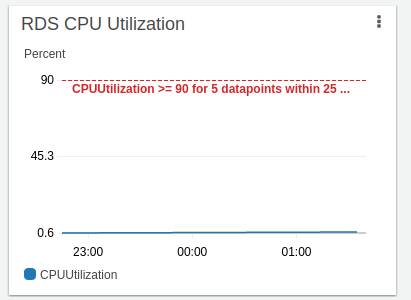
Another nice feature of this is annotations, you can use an existing CloudWatch alarms to add annotations to graphs to show if/when an alarm was triggered when a certain metric was met.

Here is an example using an RDS CPU alarm:

1
2
3
4
5
6
7
8
9
10
11
12
13
14
15
16
17
18
19
20
21
22
rds_cpu_alarm = database.metric_cpu_utilization().create_alarm(
self,
"DBCPUAlarm",
actions_enabled=actions_enabled,
threshold=90,
comparison_operator=aws_cloudwatch.ComparisonOperator.GREATER_THAN_OR_EQUAL_TO_THRESHOLD,
statistic="avg",
evaluation_periods=5,
treat_missing_data=aws_cloudwatch.TreatMissingData.NOT_BREACHING
)

dashboard.add_widgets(
aws_cloudwatch.GraphWidget(
title="RDS CPU Utilization",
left=[database.metric_cpu_utilization()],
left_annotations=[rds_cpu_alarm.to_annotation()]
),
aws_cloudwatch.GraphWidget(
title="RDS Connections",
left=[database.metric_database_connections()]
)
)

The database isn’t very busy yet but it ends up with a nice red line that will trigger once the alarm criteria is met.
Dashboards defined with CDK are much easier to write then regular CloudFormation. This will result in them being used more and will result in more consistent dashboards when the same code is used for all environments. No more hand made/inconsistent dashboards.